


Landscape Change Monitoring System (LCMS) Science Team
Time series of Landsat satellite imagery spanning from the 1980s to present are a rich source of information about how land cover has changed over the years. Landsat has recorded spatial patterns of disturbance and recovery in forests that are critical for understanding trends in resources such as carbon, water, habitat, and fiber.
Conceived in conjunction with the U.S. Geological Survey, NASA, and numerous universities, scientists with remote sensing expertise from the Forest Service’s Rocky Mountain Research Station now lead the Landscape Change Monitoring System (LCMS) Science Team. This group helps to guide the Landscape Change Monitoring System (LCMS) production team and identify and improve the state of the art in processing Landsat and Sentinel-2 time series imagery for land cover change mapping.
The Landscape Change Monitoring System is a remote sensing-based system for mapping and monitoring landscape change across the United States. The USFS Field Services Innovation Center - Geospatial Office (FSIC-GO) works with the Rocky Mountain Research Station Science team to produce Landscape Change Monitoring System annual maps depicting landscape change, land cover, and land use from 1985 to present that can be used to assist with a wide range of land management applications.
An overview of the Landscape Change Monitoring System Data Products can be found at the Landscape Change Monitoring System Home Page.
The Landscape Change Monitoring System (LCMS) uses an ensemble modeling approach to generate a “best available” map covering multiple disturbance processes and diverse cover types. Vegetation cover change, land cover, and land use are modeled using predictor layers derived from two change-detection algorithms (LandTrendr and CCDC) and terrain variables. Training data points are identified using a stratified random sample and are photo-interpreted using the TimeSync visualization software and other relevant geospatial layers. Using ancillary datasets, the Landscape Change Monitoring System further refines modeled vegetation change into additional classes that define the causes of landscape change.
Because no algorithm is expected to perform best in all situations, this approach provides a framework for intelligently assimilating the varied strengths of existing change-detection algorithms into one comprehensive change map that leverages advances in time series-based change detection techniques, Landsat and Sentinel-2 data availability, cloud-based computing power, and big data analysis methods.
All Landscape Change Monitoring System map products are recreated and updated annually following the most recent growing season.
With the help of regional and national forest staffs we have identified many applications of Landscape Change Monitoring System data, including forest planning and revision, updating existing vegetation maps, assessing landscape conditions, supporting post-fire recovery, and meeting some broad-scale monitoring requirements.

Animation of Landscape Change Monitoring System Change in Northern
The Forest Service Forest Inventory and Analysis Program (FIA) is the nation’s forest inventory. One of the Forest Inventory and Analysis Program's current goals is to improve the precision of statistical estimates over relatively small areas, and a primary strategy toward this goal is the use of maps to reduce variances. Unlike other national land cover maps, Landscape Change Monitoring System differentiates forestland use from tree cover, a critical distinction when it comes to improving the precision of Forest Inventory and Analysis’s estimates of forestland. Housman et al (2026) shows that using Landscape Change Monitoring System Land Use maps for fine-scale estimates of forestland area improves precision in a way that is equivalent to tripling the number of field plots, a savings of tens of millions of dollars.
Researchers with the University of Missouri’s School of Natural Resources used Landscape Change Monitoring System vegetation loss data as an ancillary data layer to help identify managed pine plantations throughout the state of Missouri. By focusing on the footprint of year-over-year forest disturbance captured by the Landscape Change Monitoring System, they were able to efficiently locate and verify pine plantations, providing the critical training data needed for a high-resolution machine learning model to distinguish managed plantations from natural ecological systems.
Landscape Change Monitoring System map products are recreated and updated every year after the most recent growing season, keeping the time series current and consistently available each year for monitoring land cover, land use, and change. New in v2024-10 (released 2025):
- The Change product is now available as 15 Cause of Change Classes. The final Change classes are created through post-processing with extensive ancillary datasets to categorize the modeled Change classes (Fast Loss, Slow Loss, and Gain).
- The ability to view the products and their accuracies at different levels of class binning, allowing the user to balance their need for thematic detail and accuracy.
- Landscape Change Monitoring System data for all of Alaska (previously only available for southeast Alaska).
In the coming release cycle, users can expect the next annual updates for the main study areas, typically delivered in late spring for CONUS and Alaska, with Puerto Rico/USVI and Hawaii following later in the summer, supporting ongoing applications like post-fire recovery tracking, vegetation map updates, and broad-scale monitoring.
Landscape Change Monitoring System data are available for viewing, analysis, and download through the Landscape Change Monitoring System Data Explorer, Google Earth Engine, the Interdepartmental Imagery Publication Platform, and the FSGeodata Clearinghouse.
The LCMS Data Explorer is a web-based application that provides users the ability to view, analyze, summarize, and download LCMS data. A user-friendly set of tools allows users to upload or draw an area of interest and perform pixel- and area-based summaries with a charting feature displaying the results of all LCMS outputs. A tutorial is available in the Viewer Support menu.
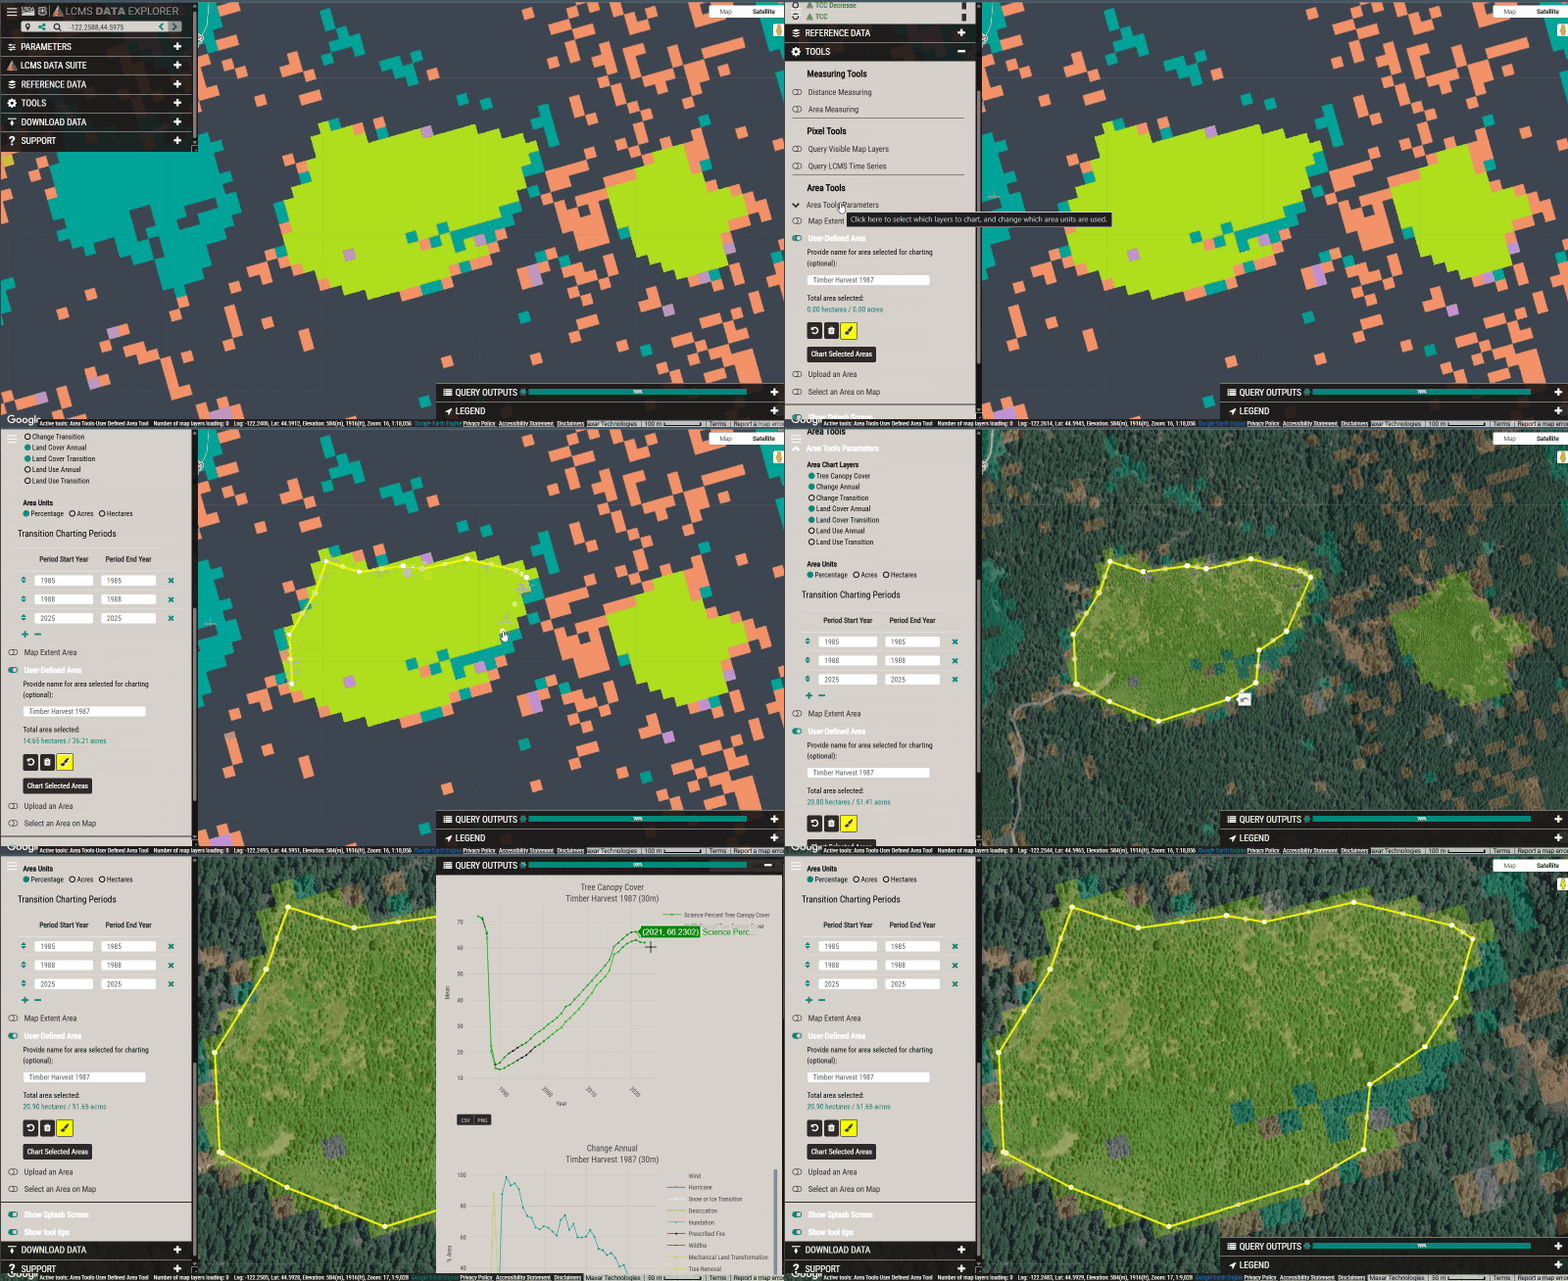
Screen capture video demonstrating the Area Charting tool in the Landscape Change Monitoring System Data Explorer
People
Staff
-
Person

Sean P. Healey, PhD
Research Ecologisthttps://research.fs.usda.gov/about/people/sean.healey -
Person
Zhiqiang Yang
Computer Scientisthttps://research.fs.usda.gov/about/people/zhiqiang.yang -
Person

Karen G. Schleeweis, PhD
Supervisory Biological Scientisthttps://research.fs.usda.gov/about/people/karen.schleeweis
Collaborators
- Tom Loveland, USGS EROS
- Evan Brooks, Virginia Tech
- Alexander Hernandez, Utah State University
- Chengquan Huang, University of Maryland
- Joseph Hughes, Oregon State University
- Robert Kennedy, Oregon State University
- Steve Stehman, SUNY ESF
- Dan Steinwand, USGS EROS
- Jim Vogelmann, USGS EROS
- Curtis Woodcock, Boston University
- Limin Yang, USGS EROS
- Zhe Zhu, USGS EROS
Publications
- Eric Bullock, Sean P. Healey, Zhiqiang Yang, Phoebe Oduor, Noel Gorelick, Steve Omondi, Edward Ouko, Warren B. Cohen. 2021. Three decades of land cover change in East Africa
- Warren B. Cohen, Sean P. Healey, Zhiqiang Yang, Zhe Zhu, Noel Gorelick. 2020. Diversity of algorithm and spectral band inputs improves Landsat monitoring of forest disturbance
- Warren B. Cohen, Zhiqiang Yang, Sean P. Healey, Robert E. Kennedy, Noel Gorelick. 2018. A LandTrendr multispectral ensemble for forest disturbance detection
- Sean P. Healey, Warren B. Cohen, Zhiqiang Yang, C. Kenneth Brewer, Evan B. Brooks, Noel Gorelick, Alexander J. Hernandez, Chengquan Huang, M. Joseph Hughes, Robert E. Kennedy, Thomas R. Loveland, Gretchen Moisen, Todd A. Schroeder, Stephen V Stehman, James E. Vogelmann, Curtis E. Woodcock, Limin Yang, Zhe Zhu. 2018. Mapping forest change using stacked generalization: An ensemble approach
Access more information about the Landscape Change Monitoring System
-
Dashboard
 https://research.fs.usda.gov/rmrs/products/dataandtools/landscape-change-monitoring-system-lcms